Visual Representation Basics I
Materials for class on Monday, January 28, 2019
Contents
Tweet of the day
Visual encoding is itself a data transformation, often applied after a chain of other transformations. This is “first week of class”, table stakes stuff. Sad if true that we don’t internalize this!
— Jeffrey Heer (@jeffrey_heer) August 11, 2018
Enrico Bertini is a data visualization researcher at NYU who co-hosts (with Moritz Stefaner) the podcast “Data Stories”, which I highly recommend.
,Jeff Heer is a leading researcher in data visualization; he helped develop D3, Trifacta, Vega, and has had countless other publications. My personal favorite is his already classic 2009 “Brief History of Data Visualization” talk on YouTube.
Slides
Helpful Materials
Omayma Said’s Intro to the Tidyverse: Data Manipulation using dplyr
Garrick Aden Buie’s A Gentle Guide to the Grammar of Graphics with ggplot2
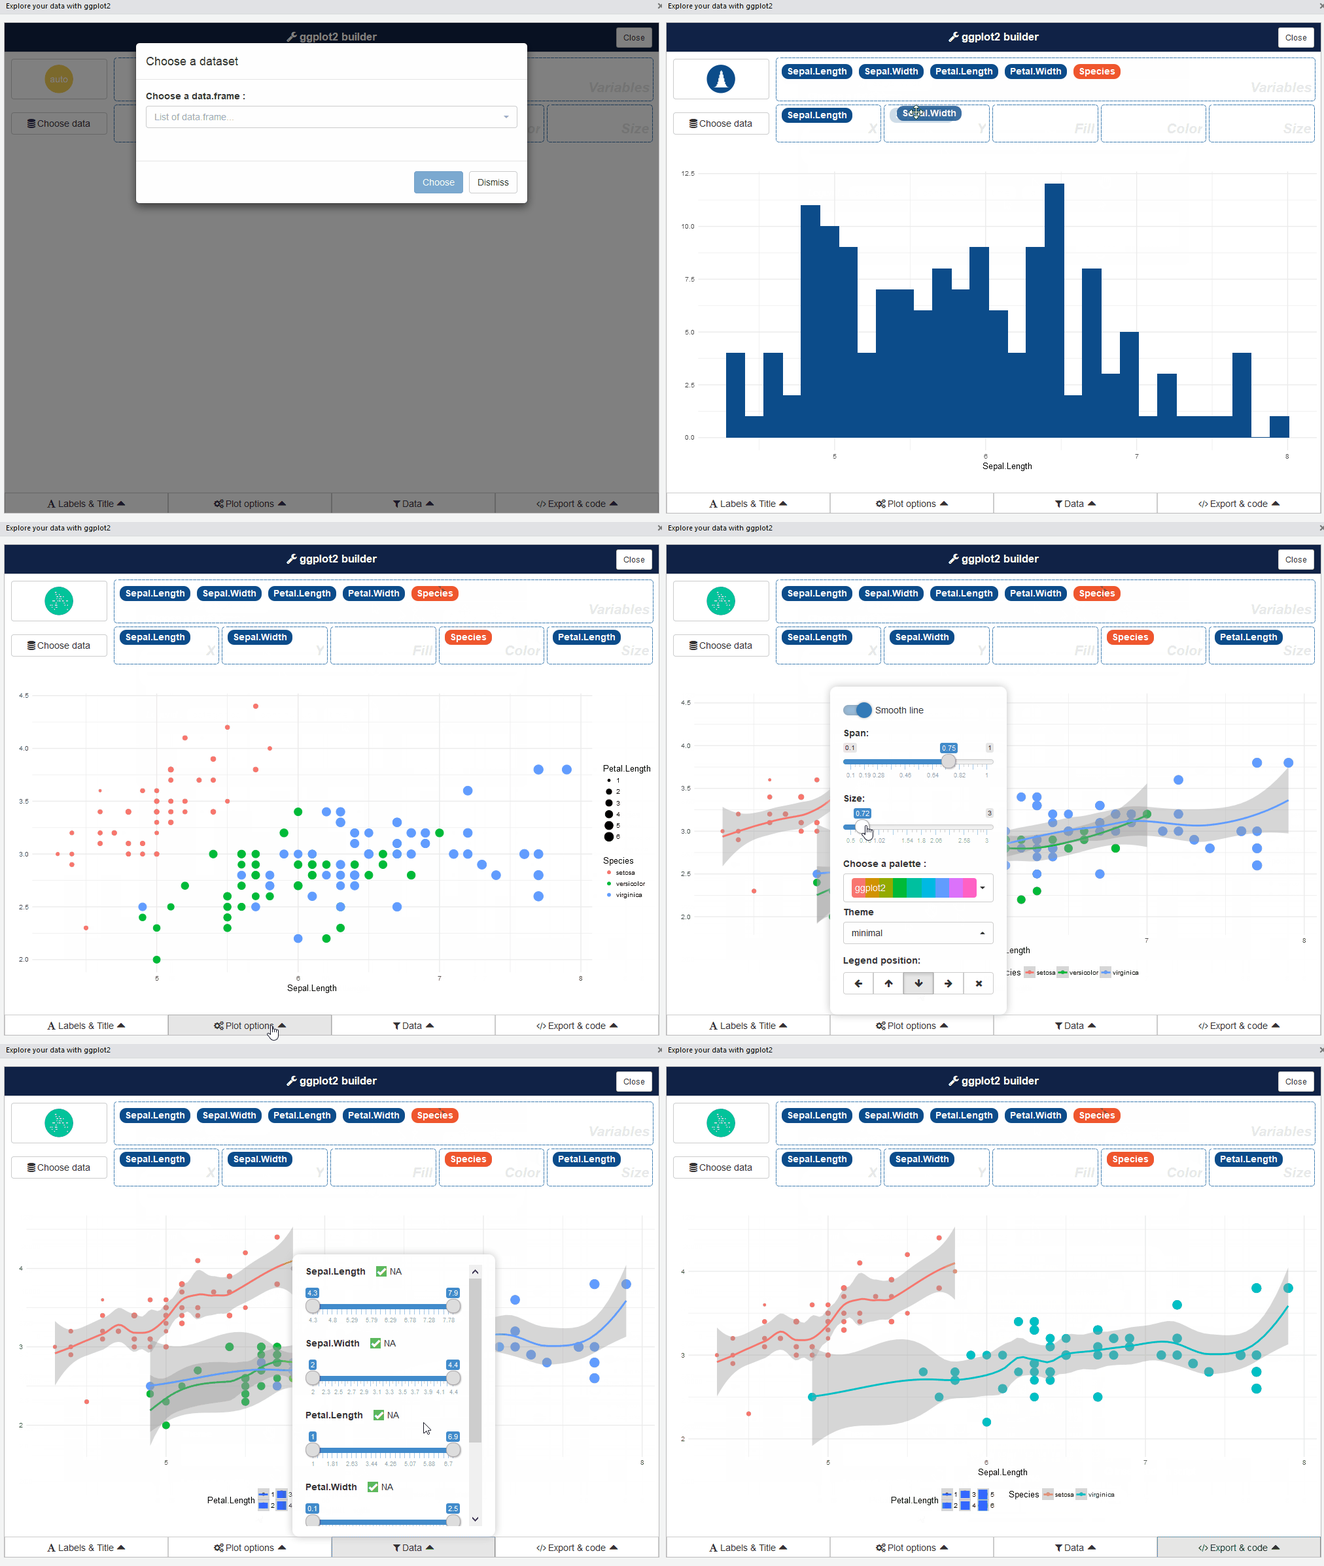
esquisse: ggplot2 add-in
