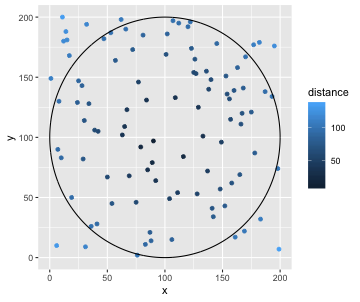
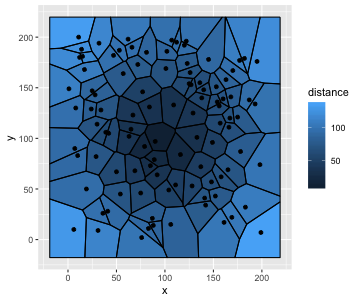
class: center, middle, inverse, title-slide # DSBA 5122: Visual Analytics ## Class 4: Time and Space ### Ryan Wesslen ### February 11, 2019 --- class: center, middle, inverse # Time and space <img src="../images/slides/04-class/2chainz.gif" width="600px" style="display: block; margin: auto;" /> --- # Time and Space - why? <img src="../images/slides/04-class/why.png" width="700px" style="display: block; margin: auto;" /> --- class: center, middle, inverse # Time: Cairo Chapter 8 and Wilke Chapters 13-14 <blockquote class="twitter-tweet tw-align-center" width="70%" data-lang="en"><p lang="en" dir="ltr">Visualisation of the streamflow across the <a href="https://twitter.com/hashtag/Alps?src=hash&ref_src=twsrc%5Etfw">#Alps</a> during today’s <a href="https://twitter.com/hashtag/Foehn?src=hash&ref_src=twsrc%5Etfw">#Foehn</a> event. Uplift and resulting snowfall on the windward side (right) and strong Foehn winds down the lee slopes (centre). Explanations: see below. Made with <a href="https://twitter.com/hashtag/ggplot2?src=hash&ref_src=twsrc%5Etfw">#ggplot2</a> and <a href="https://twitter.com/hashtag/gganimate?src=hash&ref_src=twsrc%5Etfw">#gganimate</a>. <a href="https://t.co/goPW9H0zhO">pic.twitter.com/goPW9H0zhO</a></p>— myweather.ch (@myweather_ch) <a href="https://twitter.com/myweather_ch/status/1091426853393518592?ref_src=twsrc%5Etfw">February 1, 2019</a></blockquote> <script async src="https://platform.twitter.com/widgets.js" charset="utf-8"></script> --- class: center, middle # Trend + Seasonal + Noise <img src="../images/slides/04-class/trends.png" width="400px" style="display: block; margin: auto;" /> --- class: center, middle # Visualizing one temporal variable <img src="../images/slides/04-class/timeseries.png" width="700px" style="display: block; margin: auto;" /> --- class: center, middle # Visualizing one temporal variable <img src="../images/slides/04-class/timeseries2.png" width="700px" style="display: block; margin: auto;" /> --- class: center, middle # Visualizing one temporal variable <img src="../images/slides/04-class/timeseries3.png" width="700px" style="display: block; margin: auto;" /> --- class: center, middle # Visualizing one temporal variable <img src="../images/slides/04-class/timeseries4.png" width="700px" style="display: block; margin: auto;" /> --- class: center, middle # Visualizing Indexes <img src="../images/slides/04-class/index1.png" width="700px" style="display: block; margin: auto;" /> --- class: center, middle # Visualizing Indexes <img src="../images/slides/04-class/index2.png" width="700px" style="display: block; margin: auto;" /> --- class: center, middle # Visualizing two temporal variables <img src="../images/slides/04-class/timeseries5.png" width="700px" style="display: block; margin: auto;" /> --- class: center, middle # Visualizing two temporal variables <img src="../images/slides/04-class/timeseries6.png" width="700px" style="display: block; margin: auto;" /> --- class: center, middle # Ratios to log <img src="../images/slides/04-class/ratio.png" width="700px" style="display: block; margin: auto;" /> --- class: center, middle # Ratios to log <img src="../images/slides/04-class/log.png" width="700px" style="display: block; margin: auto;" /> --- class: center, middle # Mix effects <img src="../images/slides/04-class/mix.png" width="700px" style="display: block; margin: auto;" /> --- class: center, middle # Timelines storyteller <img src="../images/slides/04-class/dailyroutines.gif" width="700px" style="display: block; margin: auto;" /> <https://timelinestoryteller.com/> --- class: center, middle # Example: Charlotte Protest Tweets <img src="../images/slides/04-class/charlotteprotest.png" width="700px" style="display: block; margin: auto;" /> --- class: middle, inverse, center # Spatial/Maps: Cairo Chap. 10 and Wilke Chap. 15 <blockquote class="twitter-tweet tw-align-center" width="60%" data-lang="en"><p lang="en" dir="ltr">A nice example of projection distortion! How big is Alaska really? <a href="https://t.co/37I6wre2dM">https://t.co/37I6wre2dM</a></p>— TimSalabim (@TimSalabim3) <a href="https://twitter.com/TimSalabim3/status/1026193095568838657?ref_src=twsrc%5Etfw">August 5, 2018</a></blockquote> <script async src="https://platform.twitter.com/widgets.js" charset="utf-8"></script> --- class: center, middle # Scale <img src="../images/slides/04-class/scale.png" width="600px" style="display: block; margin: auto;" /> --- class: center, middle # Projections <img src="../images/slides/04-class/projection.png" width="700px" style="display: block; margin: auto;" /> --- class: center, middle # Projections <img src="../images/slides/04-class/projection2.png" width="700px" style="display: block; margin: auto;" /> --- class: center, middle # Map encoding <img src="../images/slides/04-class/encode.png" width="700px" style="display: block; margin: auto;" /> --- class: center, middle # UVA's Racial Dot Map <img src="../images/slides/04-class/dotmap.png" width="500px" style="display: block; margin: auto;" /> <https://demographics.virginia.edu/DotMap/index.html> --- class: center, middle # Chloropleths <img src="../images/slides/04-class/chloropleth.png" width="600px" style="display: block; margin: auto;" /> --- # Chloropleths <img src="../images/slides/04-class/chloropleth2.png" width="600px" style="display: block; margin: auto;" /> -- <img src="../images/slides/04-class/chloropleth3.png" width="600px" style="display: block; margin: auto;" /> --- class: center, middle <img src="../images/slides/04-class/chloropleth4.png" width="700px" style="display: block; margin: auto;" /> --- class: center, middle <img src="../images/slides/04-class/chloropleth5.png" width="700px" style="display: block; margin: auto;" /> --- class: center, middle <img src="../images/slides/04-class/chloropleth6.png" width="700px" style="display: block; margin: auto;" /> --- class: center, middle <img src="../images/slides/04-class/chloropleth7.png" width="700px" style="display: block; margin: auto;" /> --- class: center, middle # kernel density <img src="../images/slides/04-class/kernel.png" width="600px" style="display: block; margin: auto;" /> --- class: center, middle # hexabin <img src="../images/slides/04-class/hex.png" width="600px" style="display: block; margin: auto;" /> --- class: center, middle # 3d height <img src="../images/slides/04-class/3d.png" width="600px" style="display: block; margin: auto;" /> --- class: center, middle # Voronoi of Airport locations <img src="../images/slides/04-class/voronoi1.png" width="600px" style="display: block; margin: auto;" /> --- class: center, middle # 3D Voronoi of Airport locations <img src="../images/slides/04-class/voronoi2.png" width="600px" style="display: block; margin: auto;" /> --- Example: `ggvoronoi` ([vignette](https://cran.r-project.org/web/packages/ggvoronoi/vignettes/ggvoronoi.html)) ```r library(ggvoronoi) head(points, n = 2) ``` ``` ## x y distance ## 1 152 43 77.15569 ## 2 14 188 123.04471 ``` .pull-left[ ```r ggplot(points) + geom_point(aes(x,y,color=distance)) + geom_path(data=circle,aes(x,y,group=group)) ``` <!-- --> ] .pull-right[ ```r ggplot(points, aes(x,y,fill=distance)) + geom_voronoi() + stat_voronoi(geom="path") + geom_point() ``` <!-- --> ]