class: center, middle, inverse, title-slide # DSBA 5122: Visual Analytics ## Class 1: Intro to Visual Analytics ### Ryan Wesslen ### January 14, 2019 --- class: center, middle # Welcome  --- # Introduce yourself - Name - What's your academic and professional background? - Programming (e.g., R, python, JavaScript, SQL) & visualization experience (e.g., Excel, ggplot2, Tableau, Spotfire) - What are you interested to learn more about data visualizations? -- To do by next class: Send me an introduction email <rwesslen@uncc.edu> answering these questions. It's up to you on length. This is my chance to learn about your background. --- 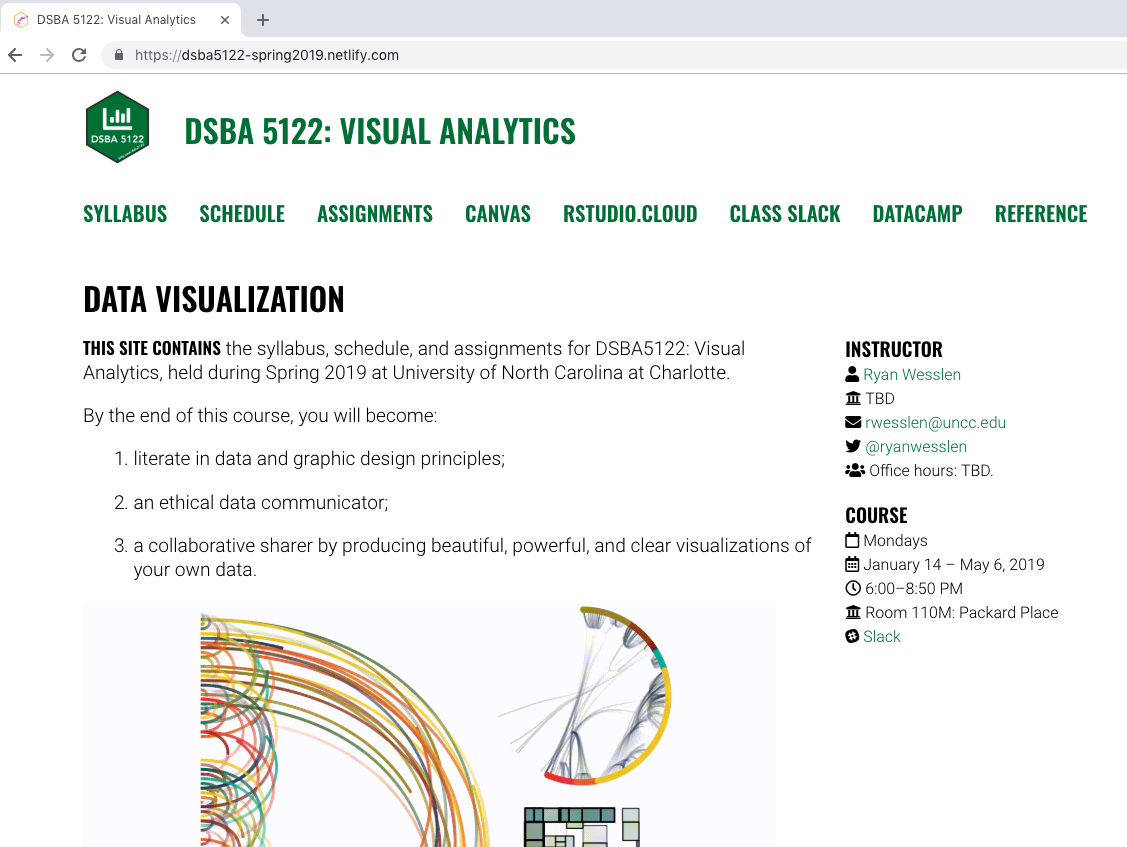 <https://dsba5122-spring2019.netlify.com> or <https://bitly.com/dsba5122> --- class: center, middle # Let's get started!  --- class: inverse, middle, center # Intro to Visual Analytics (and Information Visualization) --- # What is a visualization? ## The use of computer-supported, interactive visual representations of data to **amplify cognition**. ### - Card, Mackinley, and Shneiderman (1999) --- # Data visualization is separated into three disciplines: ### - Scientific visualization (1987) ### - Information visualization (1999) ### - Visual analytics (2005) --- class: middle, center # Scientific visualization (SciVis) .pull-left[ ## Volume Visualization <img src="../images/slides/01-class/sci-vis1.png" width="300px" style="display: block; margin: auto;" /> ] .pull-right[ ## Flow visualization <img src="../images/slides/01-class/sci-vis2.png" width="300px" style="display: block; margin: auto;" /> ] --- # Information Visualization (InfoVis) - Low-level, system 1 processing - Intuitive, perceptual decision-making - Single, isolated graph/chart - Typically, non-expert or average user -- **Goal**: identify best external (visual) representation --- # InfoVis: [Harrison et al., 2014](https://ieeexplore.ieee.org/document/7192661) Which visualization best aids in a "just-noticeable" difference in correlation? <img src="../images/slides/01-class/harrison1.gif" width="400px" style="display: block; margin: auto;" /> --- class: middle, center <img src="../images/slides/01-class/harrison2.gif" width="450px" style="display: block; margin: auto;" /> --- # InfoVis: [Harrison et al., 2014](https://ieeexplore.ieee.org/document/7192661) <img src="../images/slides/01-class/harrison3.gif" width="700px" style="display: block; margin: auto;" /> --- # Visual Analytics (VA) - High-level, system 2 processing - Effortful, deliberate decision-making - Highly interactive, coordinated-multiple views - Typically, expert or specialized knowledge -- **Goal**: "human-in-the-loop" decision-making (e.g., integrate with machine learning) -- This course is called "Visual Analytics" but includes a lot on Information Visualization. --- # VA: VAiROMA by [Cho et al., 2015](https://ieeexplore.ieee.org/abstract/document/7192676) How to visualize Roman History from Wikipedia? <img src="../images/slides/01-class/cho1.gif" width="700px" style="display: block; margin: auto;" /> --- class: middle, center # VA: VAiROMA by [Cho et al., 2015](https://ieeexplore.ieee.org/abstract/document/7192676) <img src="../images/slides/01-class/cho2.gif" width="700px" style="display: block; margin: auto;" /> --- class: inverse, middle, center ## A *Very* Brief History of Data Visualizations <img src="../images/slides/01-class/playfair.png" width="450px" style="display: block; margin: auto;" /> William Playfair, 1786 --- class: center ## Cholera in London: 1854 <img src="../images/slides/01-class/cholera_cartoon.jpg" width="330px" style="display: block; margin: auto;" /> --- .pull-left[ ## John Snow <img src="../images/slides/01-class/johnSnow.jpg" width="600px" style="display: block; margin: auto;" /> ] -- .pull-right[ ## The other John Snow <img src="../images/slides/01-class/John_Snow.jpg" width="320px" style="display: block; margin: auto;" /> ] --- background-image: url("../images/slides/01-class/snow_map.png") background-size: cover --- <img src="../images/slides/01-class/snow_map2.png" width="700px" style="display: block; margin: auto;" /> --- ## Tufte's Perspective <img src="../images/slides/01-class/tufte.png" width="160px" align="right" /> 1. Place data in an appropriate context for assessing **cause and effect**. 2. Making quantitatives comparisons (e.g., Workhouse & Brewery). 3. Considering alternative explanations and contrary cases. 4. Assessment for possible errors (e.g., compared with what?) --- background-image: url("../images/slides/01-class/minard.jpg") background-size: cover --- background-image: url("../images/slides/01-class/33863r.jpg") --- class: top, center <img src="../images/slides/01-class/33887v.jpg" width="600px" /> --- background-image: url("../images/slides/01-class/33864r.jpg") --- background-image: url("../images/slides/01-class/33892r.jpg") background-size: cover --- background-image: url("../images/slides/01-class/33889r.jpg") --- class: middle, center <iframe src="https://www.youtube.com/embed/N00g9Q9stBo" width="420" height="315" frameborder="0" allowfullscreen=""></iframe> Watch [Jeff Heer](https://homes.cs.washington.edu/~jheer/)'s 2009 "Brief History of Data Visualization". --- class: middle, center, inverse # Why look at Data? > “The greatest value of a picture is when it forces us to notice what we never expected to see.” — John Tukey <img src="../images/slides/01-class/tukey.jpg" width="200" style="display: block; margin: auto;" /> --- class: middle, center <img src="../images/slides/01-class/ch-01-anscombe-1.png" width="570px" style="display: block; margin: auto;" /> Anscombe's Quartet (1973), Healy: Ch. 1 --- class: middle, center ## Datasaurus Dozen <img src="../images/slides/01-class/DataSaurusDozen.gif" width="650px" style="display: block; margin: auto;" /> [Matejka and Fitzmaurice, 2017](https://www.autodeskresearch.com/publications/samestats) / [GitHub](https://github.com/lockedata/datasauRus) --- <img src="../images/slides/01-class/ch-01-jackman-outlier.png" width="530px" style="display: block; margin: auto;" /> --- <img src="../images/slides/01-class/ch-01-correlations-1.png" width="650px" style="display: block; margin: auto;" /> --- class: inverse, middle, center # Five Qualities of Great Visualizations "But why do I never stumble on to an article or blog post showing ... how a visualization helped a group of doctors do something remarkable? Is it just because this stuff does not get reported or what?" -Enrico Bertini (NYU) Ch. 2 of Cairo "The Truthful Art" --- background-image: url("../images/slides/01-class/hockey.png") --- ## Five Qualities of Great Visualizations 1. It is truthful. 2. It is functional. 3. It is beautiful. 4. It is insightful. 5. It is enlightening. --- # It is truthful .pull-left[ 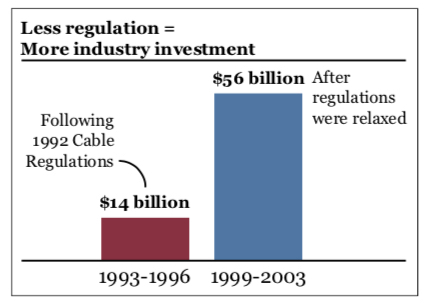 ] -- .pull-right[ 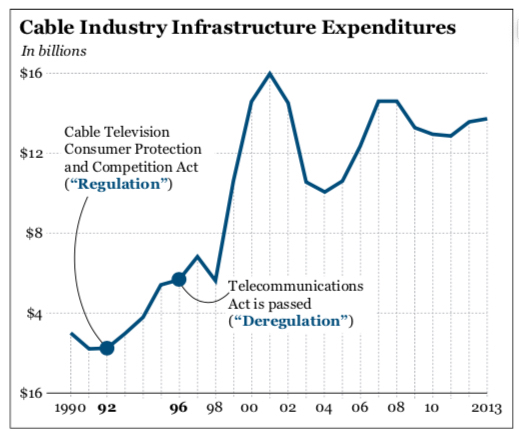 ] -- "If someone hides data from you, it’s probably because he has something to hide." (Cairo, Ch. 2) --- "Truth and untruth aren’t absolutes. They are the extremes at either end of a spectrum" (Cairo, Ch. 2) - Avoid self-deception - Be honest with your audience  --- class: middle, center # It is functional  --- class: middle, center <img src="../images/slides/01-class/functional2.png" width="650px" style="display: block; margin: auto;" /> --- class: middle, center # It is beautiful  --- background-image: url("../images/slides/01-class/ch-01-chartjunk-life-expectancy.png") background-size: cover --- background-image: url("../images/slides/01-class/ch-01-holmes-monstrous-only.png") background-size: cover --- # It is insightful “The purpose of visualization is insight, not pictures" - Card, Mackinley, and Shneiderman (1999) Two types of insight in data visualizations (Chang et al., 2009): 1. Eureka (or Aha!) moments 2. Knowledge-building --- # It is enlightening "Some topics do matter more than others indeed because **they are more critical to the well-being of more people.**" -- - What is the importance of your data visualization? -- - Find topics that are important (and fun) to understand, especially in cases where you don't know the right question to ask (i.e., exploratory data analysis).